Using iptables, you can write network activity to the log file, that is, which data is sent to and from where it comes from.
Continue reading “Logging activity using IPTables”Category Archives: Monitoring
Monitoring of Apache2 parameters in Zabbix
Install the necessary components:
sudo apt-get install curl
Activate the module information about apache2 (usually it is activated initially):
sudo a2enmod info
Open the configuration file of the module and specify the IP address of the zabbix server to allow it to view information about apache2 (if apache2 is on the local machine, then access is usually allowed by specifying local or 127.0.0.1):
sudo nano /etc/apache2/mods-enabled/status.conf
In the nano editor, CTRL+X is used to exit and y/n to save or discard changes. Example of specifying IP:
<Location /server-status>
    SetHandler server-status
    Require local
    Require ip 192.168.1.5
</Location>
Restart the web server to apply the changes:
sudo service apache2 restart
Now the information about apache2 is available through the browser by the link http://HOST/server-status
Let’s move on to Zabbix. Create a folder for scripts if it does not exist:
mkdir /etc/zabbix/scripts/
chown root:zabbix -R /etc/zabbix/scripts/
chmod 750 /etc/zabbix/scripts/
In the zabbix server configuration file, we specify the path to this folder:
sudo nano /etc/zabbix/zabbix_server.conf
ExternalScripts=PATH
Now I will give the content of the script:
#!/bin/bash
if [[ -z "$1" || -z "$2" || -z "$3" ]]; then
  exit 1
fi
##### PARAMETERS #####
RESERVED="$1"
METRIC="$2"
URL="$3"
STATSURL="${URL}?auto"
#
CACHE_TTL="55"
CACHE_FILE="/tmp/zabbix.apache2.`echo ${URL} | md5sum | cut -d" " -f1`.cache"
EXEC_TIMEOUT="2"
NOW_TIME=`date '+%s'`
##### RUN #####
if [ -s "${CACHE_FILE}" ]; then
  CACHE_TIME=`stat -c"%Y" "${CACHE_FILE}"`
else
  CACHE_TIME=0
fi
DELTA_TIME=$((${NOW_TIME} - ${CACHE_TIME}))
#
if [ ${DELTA_TIME} -lt ${EXEC_TIMEOUT} ]; then
  sleep $((${EXEC_TIMEOUT} - ${DELTA_TIME}))
elif [ ${DELTA_TIME} -gt ${CACHE_TTL} ]; then
  echo "" >> "${CACHE_FILE}" # !!!
  DATACACHE=`curl -sS --insecure --max-time ${EXEC_TIMEOUT} "${STATSURL}" 2>&1`
  echo "${DATACACHE}" > "${CACHE_FILE}" # !!!
  echo "URL=${URL}"  >> "${CACHE_FILE}" # !!!
  chmod 640 "${CACHE_FILE}"
fi
#
if [ "${METRIC}" = "accesses" ]; then
  cat "${CACHE_FILE}" | grep -i "accesses" | cut -d':' -f2 | head -n1
fi
if [ "${METRIC}" = "kbytes" ]; then
  cat "${CACHE_FILE}" | grep -i "kbytes" | cut -d':' -f2 | head -n1
fi
if [ "${METRIC}" = "cpuload" ]; then
  cat "${CACHE_FILE}" | grep -i "cpuload" | cut -d':' -f2 | head -n1
fi
if [ "${METRIC}" = "uptime" ]; then
  cat "${CACHE_FILE}" | grep -i "uptime" | cut -d':' -f2 | head -n1
fi
if [ "${METRIC}" = "avgreq" ]; then
  cat "${CACHE_FILE}" | grep -i "ReqPerSec" | cut -d':' -f2 | head -n1
fi
if [ "${METRIC}" = "avgreqbytes" ]; then
  cat "${CACHE_FILE}" | grep -i "BytesPerReq" | cut -d':' -f2 | head -n1
fi
if [ "${METRIC}" = "avgbytes" ]; then
  cat "${CACHE_FILE}" | grep -i "BytesPerSec" | cut -d':' -f2 | head -n1
fi
if [ "${METRIC}" = "busyworkers" ]; then
  cat "${CACHE_FILE}" | grep -i "BusyWorkers" | cut -d':' -f2 | head -n1
fi
if [ "${METRIC}" = "idleworkers" ]; then
  cat "${CACHE_FILE}" | grep -i "idleworkers" | cut -d':' -f2 | head -n1
fi
if [ "${METRIC}" = "totalslots" ]; then
  cat "${CACHE_FILE}" | grep -i "Scoreboard" | cut -d':' -f2 | sed -e 's/ //g' | wc -c | awk '{print $1-1}'
fi
#
exit 0
Let’s make the script file executable:
chown root:zabbix /etc/zabbix/scripts/apache2-status.sh
chmod 550 /etc/zabbix/scripts/apache2-status.sh
Script validation example:
sudo -u zabbix /etc/zabbix/scripts/apache2-status.sh none accesses http://HOST/server-status
Open the zabbix agent configuration file in the editor:
sudo nano /etc/zabbix/zabbix_agentd.conf
And we will specify the following parameters:
UserParameter=apache2[*],/etc/zabbix/scripts/apache2-status.sh "none" "$1" "$2"
Some commands allow you to see the number of apache2 processes and connections to port 80, for this you do not need a script, for example, you can specify:
UserParameter=apache2.count_processes,ps aux | grep apache | wc -l
UserParameter=connections_on_80_port,netstat -na | grep :80 | wc -l
Restart the zabbix agent to apply the changes:
sudo /etc/init.d/zabbix-agent restart
Let’s check:
zabbix_get -s 127.0.0.1 -k "apache2[accesses,http://HOST/server-status]"
Now we will create a template and add data elements, an example of created data items:
apache2[KEY,http://HOST/server-status]
Exported ready template – apache2-status
We also need to add a macro to the monitored host:
Macro: {$APACHE_STATS_URL}
Value: http://HOST/server-status
Done.
The number of apache2 processes can be obtained from the Zabbix agent by creating on the Zabbix server a data element with a key:
proc.num[apache2]
Diagnostics HDD using smartmontools
smartmontools – (S.M.A.R.T. Monitoring Tools) console utility for diagnosing the status of hard drives supporting S.M.A.R.T. technology.
smartmontools has two utilities, smartctl for monitoring S.M.A.R.T. and a smartd background process that automatically polls devices and records errors.
Installation in Linux Ubuntu/Debian:
sudo apt-get install smartmontools
Help about the utility:
smartctl -h
Examples:
Verification of the support of S.M.A.R.T. and SCT ERC:
smartctl -i -d sat /dev/sda
sudo smartctl -a /dev/sda  | grep SCT
Full information about HDD:
smartctl --all /dev/sda
HDD status evaluation:
smartctl -H /dev/sda
HDD error log:
smartctl -l error /dev/sda
Drive integrity test:
smartctl --test long /dev/sda
See also:
Description of SMART attributes
Linux disk test for errors and broken sectors
Installing and Configuring SNMPD + MRTG
MRTG (Multi Router Traffic Grapher) – a tool for displaying various data in graphs.
The installation command in Ubuntu/Debian:
sudo apt-get install mrtg snmp snmpd
In CentOS:
yum install mrtg net-snmp net-snmp-utils
The command below can tell you which additional modules are in the repository:
apt-cache search mrtg
Open the configuration file /etc/snmp/snmpd.conf
sudo nano /etc/snmp/snmpd.conf
Comment on the line:
com2sec paranoid default public
And uncomment the line:
com2sec readonly default public
Restart snmpd so that changes to the configuration file take effect:
sudo /etc/init.d/snmpd restart
You can check snmp by commands:
netstat -nlp | grep snmpd
snmpwalk -v2с -c public localhost
Beginners can generate a simple configuration file with the command:
sudo cfgmaker public@localhost >> /etc/mrtg.cfg
where public is the name of the community (the password is in other words), and localhost is the host address or ip.
Example of starting the configuration file /etc/mrtg.cfg:
WorkDir: /var/www/mrtg
Options[_]: growright, bits, nobanner
Background[_]: #B0C4DE
EnableIPv6: no
Language: russian
EnableSnmpV3: no
Interval: 10
Refresh: 600
Include: /etc/mrtg/server1.cfg
Include: /etc/mrtg/server2.cfg
Create the working directory:
sudo mkdir /var/www/mrtg
Then you must write or generate the index.html file with the command:
sudo indexmaker /etc/mrtg.cfg > /var/www/mrtg/index.html
We look at the log /var/log/mrtg.log so that there are no errors.
Here is an example of setting up SNMP on D-Link switches:
private CommunityView Read Write
public CommunityView Read Only
Example of a manual start script (mrtg.sh):
#!/bin/bash
#run mrtg
LANG=C
export $LANG
/usr/bin/mrtg /etc/mrtg.cfg --logging /var/log/mrtg.log
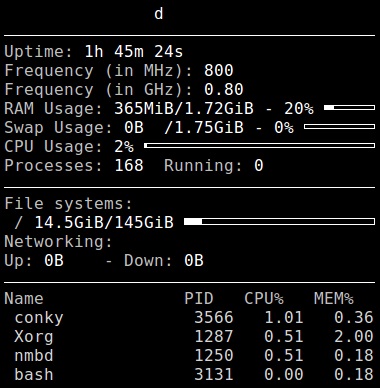
Installing and using Conky in Linux
Conky – system monitor.
The installation command in Ubuntu:
sudo apt-get install conky
In CentOS/Fedora:
sudo yum install conky
Start command:
conky
At the first start, I displayed this window:
The configuration files are located in the /etc/conky/.
To read the built-in documentation, you can run the following command:
man conky
Example of launching in a background with an update interval of 2 sec.:
conky -d -u 2
To stop, you can use the command:
pkill conky
Installing Ostinato in Ubuntu
Ostinato – program for network analysis and traffic generation.
The Ostinato installation command in Ubuntu:
sudo apt-get install ostinato
The launch is performed in a graphical mode by reference or by the command:
sudo ostinato
To remove Ostinato, you can run the following command:
sudo apt-get purge ostinato