To raise the network interface in Linux without an IP address, simply run the command:
Continue reading “Network interface in Linux without IP address”Category Archives: Networks
How to enable or disable Proxy ARP on Linux
Let’s look at the status of Proxy ARP (1 – enabled, 0 – disabled):
Continue reading “How to enable or disable Proxy ARP on Linux”Accel-ppp installation
In this article, I’ll give an example of how to build and install accel-ppp in Ubuntu Server.
Continue reading “Accel-ppp installation”How to crimp a twisted pair connector RJ45 / 8P8C
Crimping the connector is carried out with a special crimping tool (crimping pliers), in extreme cases if they are not available you can use a flat thin screwdriver. First carefully remove the 3 centimeters of the upper braid cable, weave pairs of conductors and align in a row according to the standard that we need. Superfluous ends cut off to about 1cm remained. We put it into the connector so that the conductors have reached the very end of the connector and have rested, the outer insulation of the cable should also as far as possible go into the connector. We check that the colors are not messed up when inserting, we insert it into the crimper and squeeze. Done.
Twisted pair crimp standards:
1) direct link, the most used, is often used to connect a computer with a switch, a router, etc. Both connectors are crimped the same way.
white-orange / orange / white-green / blue / white-blue / green / white-brown / brown
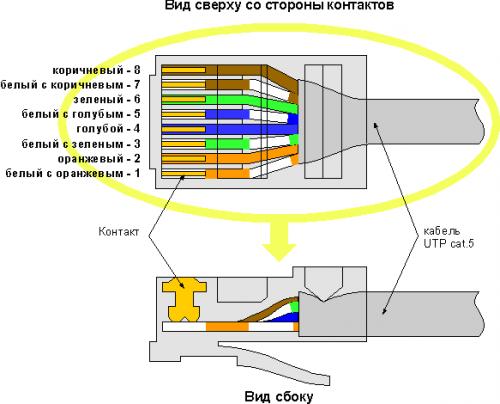
2) cross-link, it is used to connect two computers to each other, but in our time computers can be connected and the cable is compressed by the standard above, so it is used quite rarely. One connector is crimped as indicated below, the second as indicated above.
white-green / green / white-orange / blue / white-blue / orange / white-brown / brown
Installing xrdp on Ubuntu
xrdp – RDP server for Linux
It is installed in Ubuntu with the following command:
sudo apt-get install xrdp
To connect to an xrdp server from Windows, you can use the standard Remote Desktop client by typing mstsc.exe at the command prompt.
The configuration is located here /etc/xrdp/, logs are written here – /var/log/xrdp-sesman.log
You can restart xrdp like this:
sudo /etc/init.d/xrdp restart
You can also install the Xfce graphical shell:
sudo apt-get -y install xfce4
And specify it by default.
echo xfce4-session >~/.xsession
I recommend not using root user to work in a graphical environment, but create an individual user.
See my article – Administering Ubuntu Users
The solution of the error “Job for puppetserver.service failed because the control process exited with error code”
I noticed once when I started Puppet server, after installation, the following error:
Job for puppetserver.service failed because the control process exited with error code. See “systemctl status puppetserver.service” and “journalctl -xe” for details.
The error occurs because there is not enough RAM and to fix the error, open the Puppet server configuration file:
sudo nano /etc/default/puppetserver
And reduce the amount of allocated RAM for the Puppet server (for example, I specified 512m instead of 2g):
JAVA_ARGS="-Xms512m -Xmx512m"
Now let’s start the Puppet server:
sudo systemctl start puppetserver
The reason for increasing RX overruns on the network adapter
I noticed once on one of the servers that the RX overruns value is growing slightly.
I executed several commands (where p2p1 and p2p2 are the names of network interfaces):
ifconfig p2p1
ifconfig p2p2
Only the value of RX overruns increased by 10 packets every second, with traffic at about 2Gb/s (100,000 packets per second).
The server was equipped with the network adapter “HP NC552SFP 10Gb 2-Port Ethernet Server Adapter” with a network controller from Emulex.
Having looked the size of the maximum and current buffer:
ethtool -g p2p1
ethtool -g p2p2
Found that the buffers are set to maximum, TX buffer is 4096, and the maximum possible RX buffer was only 512.
See also my article – Changing TX and RX network interface buffers in Linux
Having looked at the correct distribution of network card interrupts over the processor cores:
grep p2p1 /proc/interrupts
Found that the network adapter has 4 IRQ interrupts maximum, and irqbalance accordingly allocated them to 4 cores, and the processor cores are 24.
The problem was solved by replacing the network adapter with a more expensive one – “665249-B21 HP 10Gb 2-port 560SFP + Adapter” with an Intel 82599 network controller.
After that, an error was not observed, RX and TX buffers were 4096, and IRQ was distributed to all 24 cores.
After a couple of days, the error counters remained at zero:
p2p1      RX packets:62535001155 errors:0 dropped:0 overruns:0 frame:0
          TX packets:36343078751 errors:0 dropped:0 overruns:0 carrier:0
          collisions:0 txqueuelen:1000
          RX bytes:77395016742081 (77.3 TB)  TX bytes:10991051263063 (10.9 TB)

p2p2      RX packets:35672087256 errors:0 dropped:0 overruns:0 frame:0
          TX packets:58598868464 errors:0 dropped:0 overruns:0 carrier:0
          collisions:0 txqueuelen:1000
          RX bytes:10996254475480 (10.9 TB)  TX bytes:73378418623349 (73.3 TB)
Probably the previous network adapter was some kind of truncated version, since the price was two times lower, and in general for serious purposes it is better to use network adapters with a controller from Intel.
See also my article – Configuring the Network in Linux
iperf – testing network bandwidth
Iperf — cross-platform console client-server program – a TCP and UDP traffic generator for testing network bandwidth.
Continue reading “iperf – testing network bandwidth”Install and configure nprobe
Suppose we installed ntopng as I described in this article – Install and configure ntopng
That is, they selected the necessary package at http://packages.ntop.org/apt-stable/ and downloaded it:
wget wget http://apt-stable.ntop.org/16.04/all/apt-ntop-stable.deb
sudo dpkg -i apt-ntop-stable.deb
Install nprobe if it is not installed:
sudo apt-get clean all
sudo apt-get update
sudo apt-get install nprobe
To receive NetFlow data and transfer it to ntopng, create a file (in the nano editor, press CTRL+X to exit, y/x to save or discard changes):
sudo nano /etc/nprobe/nprobe-anyname.conf
Add to it:
--zmq="tcp://*:5556"
-3 2055
--flow-version 9
-n=none
-i=none
2055 is the port on which you want to receive NetFlow data, and port 5556 is used to transmit it to ntopng.
See my articles on configuring NetFlow on switches:
Configuring NetFlow on Cisco
Configuring sFlow on D-Link Switches
Setting up and using Traffic Flow in Mikrotik
Now it remains to open the ntopng configuration in a text editor:
sudo nano /etc/ntopng/ntopng.conf
And add a line at the end (thereby adding the nprobe interface to collect statistics):
--interface="tcp://127.0.0.1:5556"
It remains to restart ntopng to apply the changes:
sudo service ntopng restart
Check whether everything works:
sudo netstat -tulpen | grep 2055
sudo netstat -tulpen | grep 5556
sudo /etc/init.d/nprobe status
I noticed that nprobe does not always shut down after the command:
sudo /etc/init.d/nprobe stop
Therefore, if necessary, you can stop it like this:
sudo killall nprobe
sudo kill -9 PID
In the free version of nprobe, I had a message:
NOTE: This is a DEMO version limited to 25000 flows export.
The full version can be purchased at the official site of shop.ntop.org.
See also:
IPTables rules for nprobe
Using netwox
I will give examples of using netwox and describe them.
I described the netwox installation in this article – Установка netwox
Example of a standard startup:
sudo netwox
netwox has quite a lot of functions, you can see them by pressing after starting the number 3 and Enter.
Network configuration display:
sudo netwox 1
Display debugging information:
sudo netwox 2
Display information about the IP address or host name:
sudo netwox 3 example.com
Displaying information about the MAC address:
sudo netwox 4 -e 00:15:5D:38:01:08
Obtaining MAC addresses from the IP list:
sudo netwox 5 -i 192.168.1.0/24
Display information that will be used to reach the specified IP address:
sudo netwox 6 192.168.24.254
Sniffer, displaying the transmitted packets on the screen:
sudo netwox 7
Sniffer, displaying only the list of open ports that were used in the captured packets:
sudo netwox 8
Sniffer, mapping of MAC and IP addresses:
sudo netwox 9
An example of capturing packets and displaying brief statistics (the number of packets counted, the size of packages, the percentage of the number of packets (c%), the percentage of the size (s%)):
netwox 10 -d eth0
Convert a digit to an encrypted one:
sudo netwox 21 -n number
Converting a string to an encrypted string (sha256, md5, etc.):
sudo netwox 22 -d text
Show ASCII table:
sudo netwox 23
Check the security of the directory:
sudo netwox 25 /tmp/
Example of ICMP PING:
sudo netwox 49 -i 192.168.24.253
Example of ARP PING:
sudo netwox 55 -i 192.168.24.253
Example ICMP route tracing:
sudo netwox 57 -i examle.com
Example of TCP route tracing:
sudo netwox 59 -i examle.com
Example UDP route tracing:
sudo netwox 61 -i examle.com
Example of port scanning:
sudo netwox 67 -i 192.168.24.254 -p 1-1000
ICMP scanning for availability:
sudo netwox 65 -i 192.168.1.0/24
TCP port access scan:
sudo netwox 67 -i 192.168.1.0/24 -p 80
UDP port access scan:
sudo netwox 69 -i 192.168.1.0/24 -p 80
ARP scanning:
sudo netwox 71 -i 192.168.1.0/24
Flood random fragments:
sudo netwox 74 -i 192.168.24.254
Filling the table of MAC-addresses of the switch by sending a flood:
sudo netwox 75
Synflood:
sudo netwox 76 -i 192.168.24.254 -p 80
etc.